
Workflow Automation · 2025
SaaS Revenue Automation
A daily n8n workflow that calculates SaaS revenue metrics from Stripe, posts a readable snapshot to Slack and builds a historical log in Google Sheets.
- n8n
- Stripe API
- Google Sheets
- Slack
- JavaScript
- Year
- 2025
- Type
- Workflow Automation
- Location
- Remote
The challenge
SaaS teams have their revenue data and still cannot see it. Stripe knows every subscription and the product database knows every signup, but the numbers that actually run the business — MRR, churn, ARPA — live between those systems and belong to neither.
So somebody exports, reconciles and rebuilds the same spreadsheet weekly. It is slow, it is inconsistent between whoever does it, and because it is painful it happens less often than decisions require.
What I built
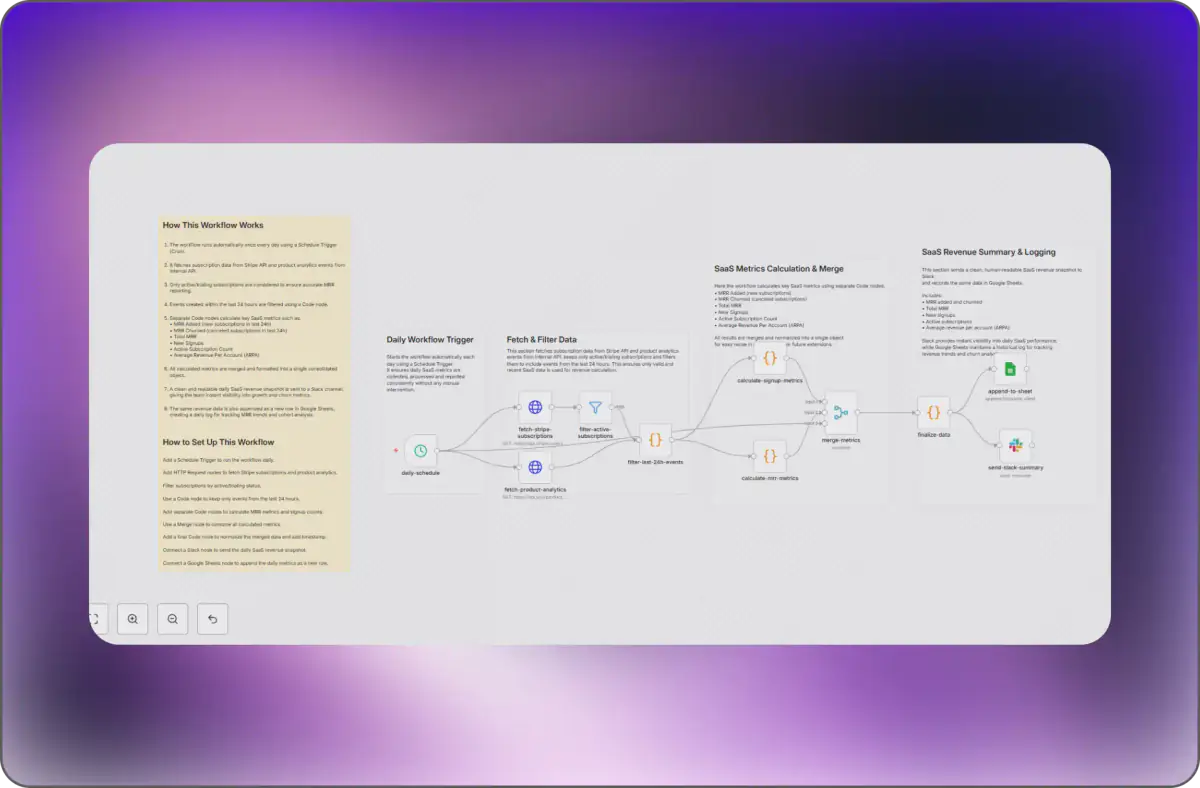
A scheduled trigger runs the workflow once daily. It pulls subscription data from the Stripe API and product analytics events from an internal API, then filters both before any calculation: only active and trialing subscriptions count toward MRR, and only events from the last 24 hours count toward daily activity. Filtering first is what keeps the numbers trustworthy — stale or cancelled records silently corrupt MRR otherwise.
Separate code nodes then compute each metric independently: MRR added from new subscriptions, MRR churned from cancellations in the last 24 hours, total MRR, new signups, active subscription count, and average revenue per account. Keeping them separate means one metric’s logic can change without endangering the rest. The results merge and normalise into a single consolidated object.
That object goes two places. A clean, human-readable snapshot posts to Slack, giving the team instant daily visibility without opening a dashboard. The same figures append as a row in Google Sheets, which is the part that compounds — each run adds to a historical record that supports MRR trend and cohort analysis no single day’s snapshot could show.
Outcome
The team gets a daily revenue snapshot with no manual work, and a growing historical dataset that makes trend and cohort analysis possible instead of theoretical.